[Monitoring 4] Prometheus-Grafana-Exporter – Giám sát Window
Như vậy ở phần 3 chúng ta đã có cách cài đặt giám sát nhanh 1 host Linux Host.
Ở phần này chúng ta sẽ tìm hiểu cách giám sát 1 host Windows.
Tóm tắt quá trình
- Cài đặt exporter trên host Window
- Add host window vào Prometheus Server
- Xây dựng đồ họa quan sát trên Grafana
Cài đặt exporter trên host Window
Link tải exporter :
https://github.com/prometheus-community/windows_exporter/releases
Sau khi cài đặt các bạn test truy cập link thu thập metrics, để đảm bảo có kết nối với Prometheus server
Link mặc định
http://IP_windows_exporter:9182/metrics
Add host window vào Prometheus Server
   - job_name: "node_exporter_windowserver"

     # metrics_path defaults to '/metrics'
     # scheme defaults to 'http'.

     static_configs:
       - targets: ["xxx.xxx.xxx.xxx:9182"]
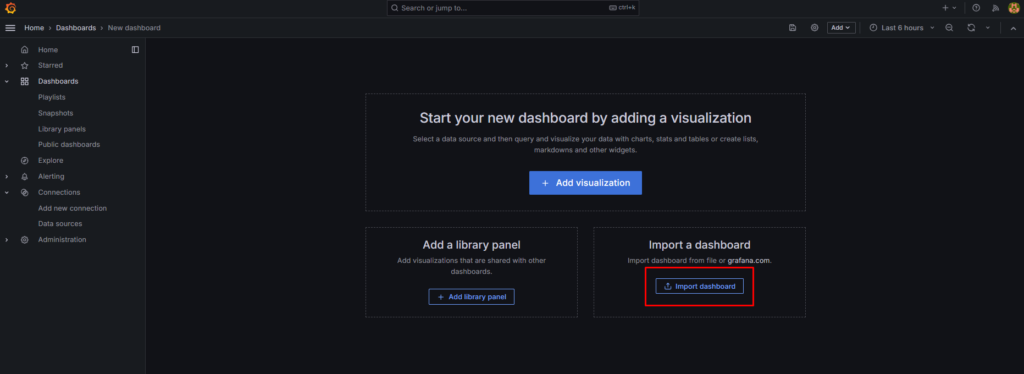
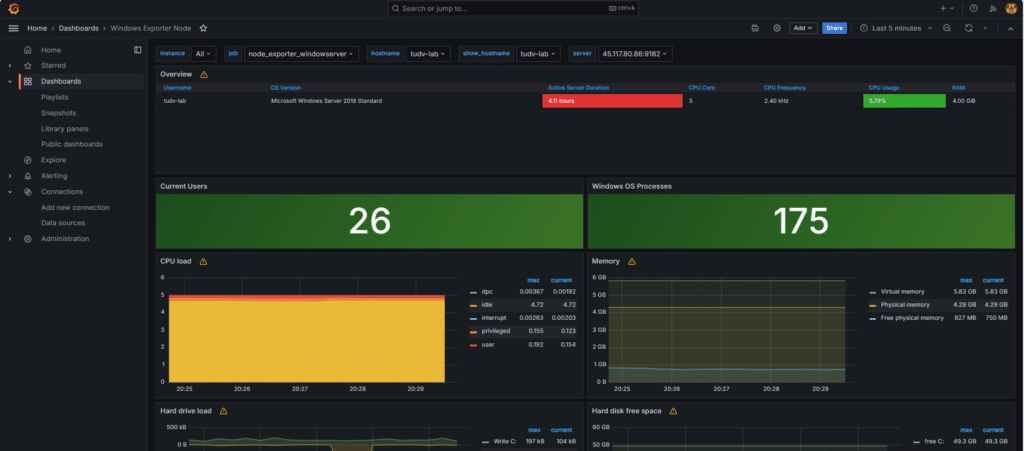
Xây dựng đồ họa quan sát trên Grafana
Mình cũng chọn 1 daskboard ID 14510 xây dựng sẵn của tác giả:
Windows Exporter Dashboard | Grafana Labs
Bạn đừng quên khởi động lại dịch vụ Promethus Server và luôn đảm bảo Exporter Window khởi động cùng hệ thống.
Hẹn gặp lại các bạn tại các bài viết sau tại wiki.nhanhoa.com